Forecasting
Household cash-flow volatility: why averages hide the real problem
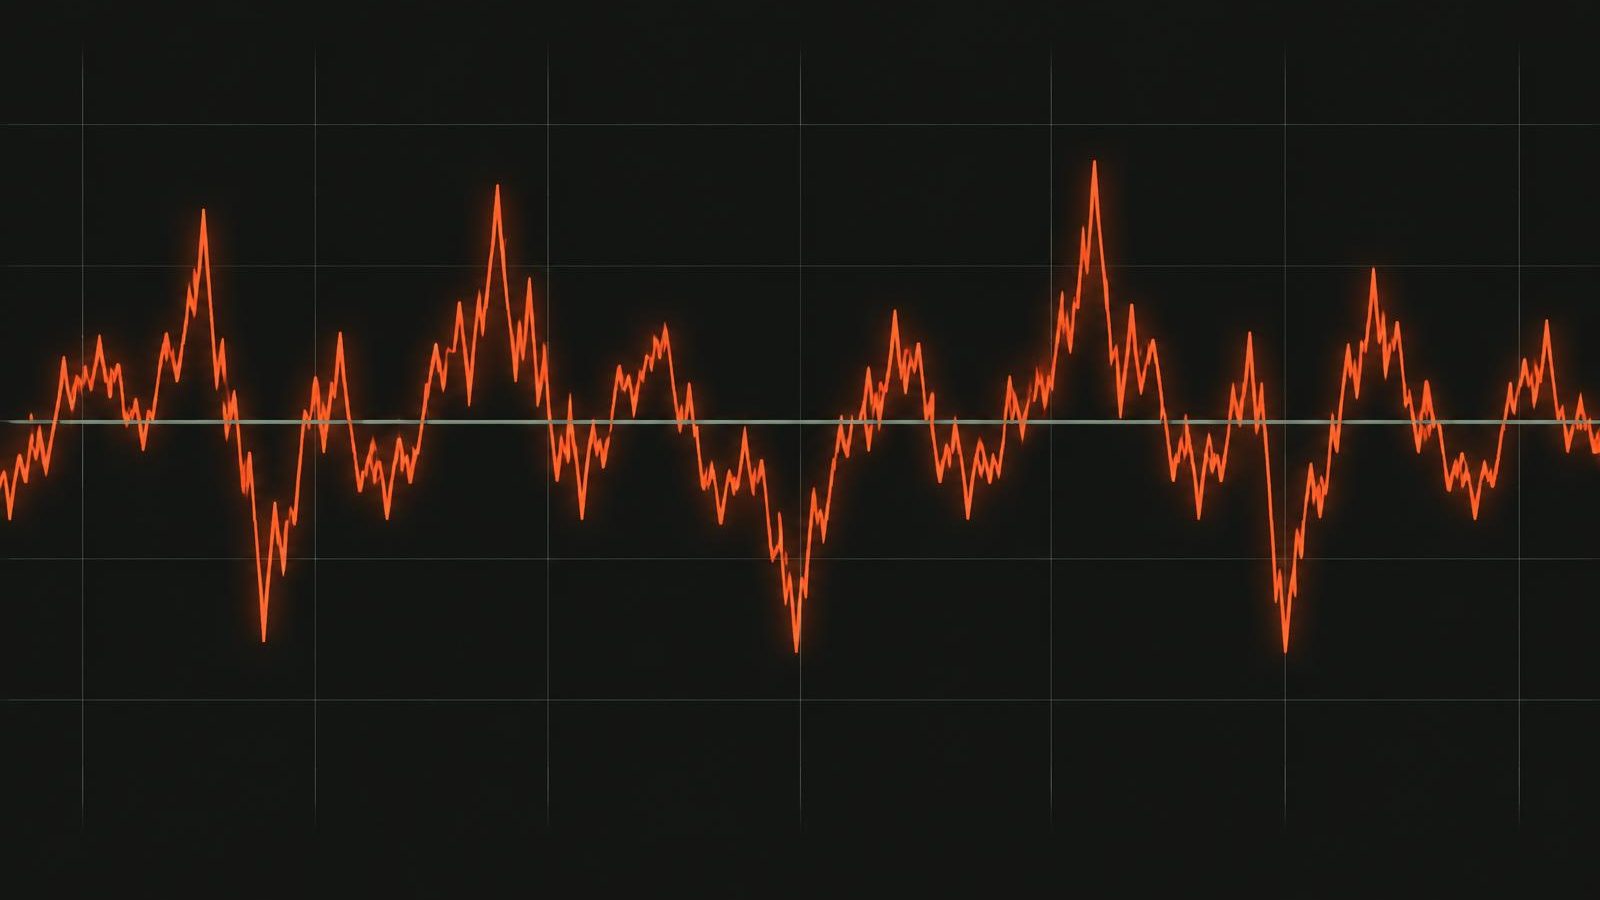
Averages hide household cash-flow risk because households do not live in average weeks. Income arrives in lumps and gaps; obligations land on fixed dates in uneven clusters. When those two uneven patterns are averaged into a single monthly figure, the result describes a smooth, manageable month that no week actually resembled — while the real weeks contained both the surpluses and the shortfalls. The shortfalls are where missed payments happen. They are invisible in the average by construction.
Volatility is not a footnote to a household's financial position. For a large share of households, it is the position.
Two households, one average
Illustrative example (fictional figures): Household A receives $1,900 every two weeks, steadily, and its obligations are spread evenly. Household B receives the same average amount — but as $3,100 in one payment and $700 in another, in an irregular rotation, while its largest obligations cluster in the first week of the month. Their average monthly income is effectively identical. Their average balance may even look similar.
Their risk is nothing alike. Household A's worst week is mildly tight. Household B regularly faces weeks where obligations exceed available cash by hundreds of dollars, bridged only if the previous surplus was preserved — an assumption real life frequently violates. Any institution assessing these households on averages will rate them the same and be surprised by only one of them, repeatedly.
Why the average is the wrong statistic
An average is a statement about the centre of a distribution. Financial distress is a statement about its edges — the lowest week, the deepest dip, the longest gap between inflows. Three properties of household cash flow conspire against the average:
- Damage is done at the minimum, not the mean. A missed payment is caused by the worst-positioned day, and it is not undone by the good weeks around it. Late fees, penalty interest, and credit consequences all trigger at the edge.
- Surpluses do not automatically transfer. The average implicitly assumes a strong week subsidizes a weak one. That requires the household to hold the surplus untouched — across the exact period when deferred spending, repairs, and family needs are also waiting.
- Volatility is patterned, not random. Swings follow shift rotations, seasonal work, payment schedules, and obligation calendars. Patterned volatility can be modelled and forecast. Treating it as noise around an average throws away the most useful information in the data.
What to measure instead
A volatility-aware view tracks the shape, not just the centre:
- Projected low points — the minimum expected position in each future window, and its date.
- Gap lengths — the longest stretches between meaningful inflows, against the obligations inside them.
- Swing amplitude — how far above and below the average the household's actual weeks run, for both income and balance.
- Recovery pattern — how quickly position rebuilds after a dip, and what rebuilds it.
These measures are computable from the same transaction data institutions already hold. They require sequence-aware analysis — reading the calendar in order — rather than period summaries.
The institutional stakes
Volatility-blindness distorts decisions across the institution. Affordability assessments pass households whose averages work but whose weeks do not, and fail others whose volatile pattern is actually well-managed. Product design defaults to monthly rhythms that mismatch how customers are paid. Support triggers fire on events — a missed payment — that the volatility pattern predicted weeks in advance.
None of this requires new data. It requires retiring the average as the primary lens for households whose defining financial feature is that their money moves unevenly.
Key takeaways
- Averages describe a smoothed month that no household actually experiences; distress happens at the edges.
- Two households with identical averages can carry completely different risk, determined by swing size and gap structure.
- Surpluses do not automatically subsidize shortfalls in real household behaviour.
- Measure low points, gap lengths, amplitude, and recovery — the shape of cash flow, not its centre.
PFSI's forward view is designed around the shape of household cash flow rather than its averages. Institutions can explore the approach through a design-partner conversation on the [Partnerships page](/partnerships).
---
About PFSI: PFSI (Personal Financial Stability Intelligence) is the financial intelligence program in development at Monimate Technologies Inc. New to PFSI? Start with [What Is PFSI?](/blog/what-is-pfsi).